
See any Thai market from the top.
Map an industry by size and margin, find where the money and risk sit, and drill from a sector to a single company. Nothing here is sampled.
The Market view is the 10,000-foot picture. Every number is computed across all 1,989,709 companies, so the map reflects the whole economy.
How do you map a market?
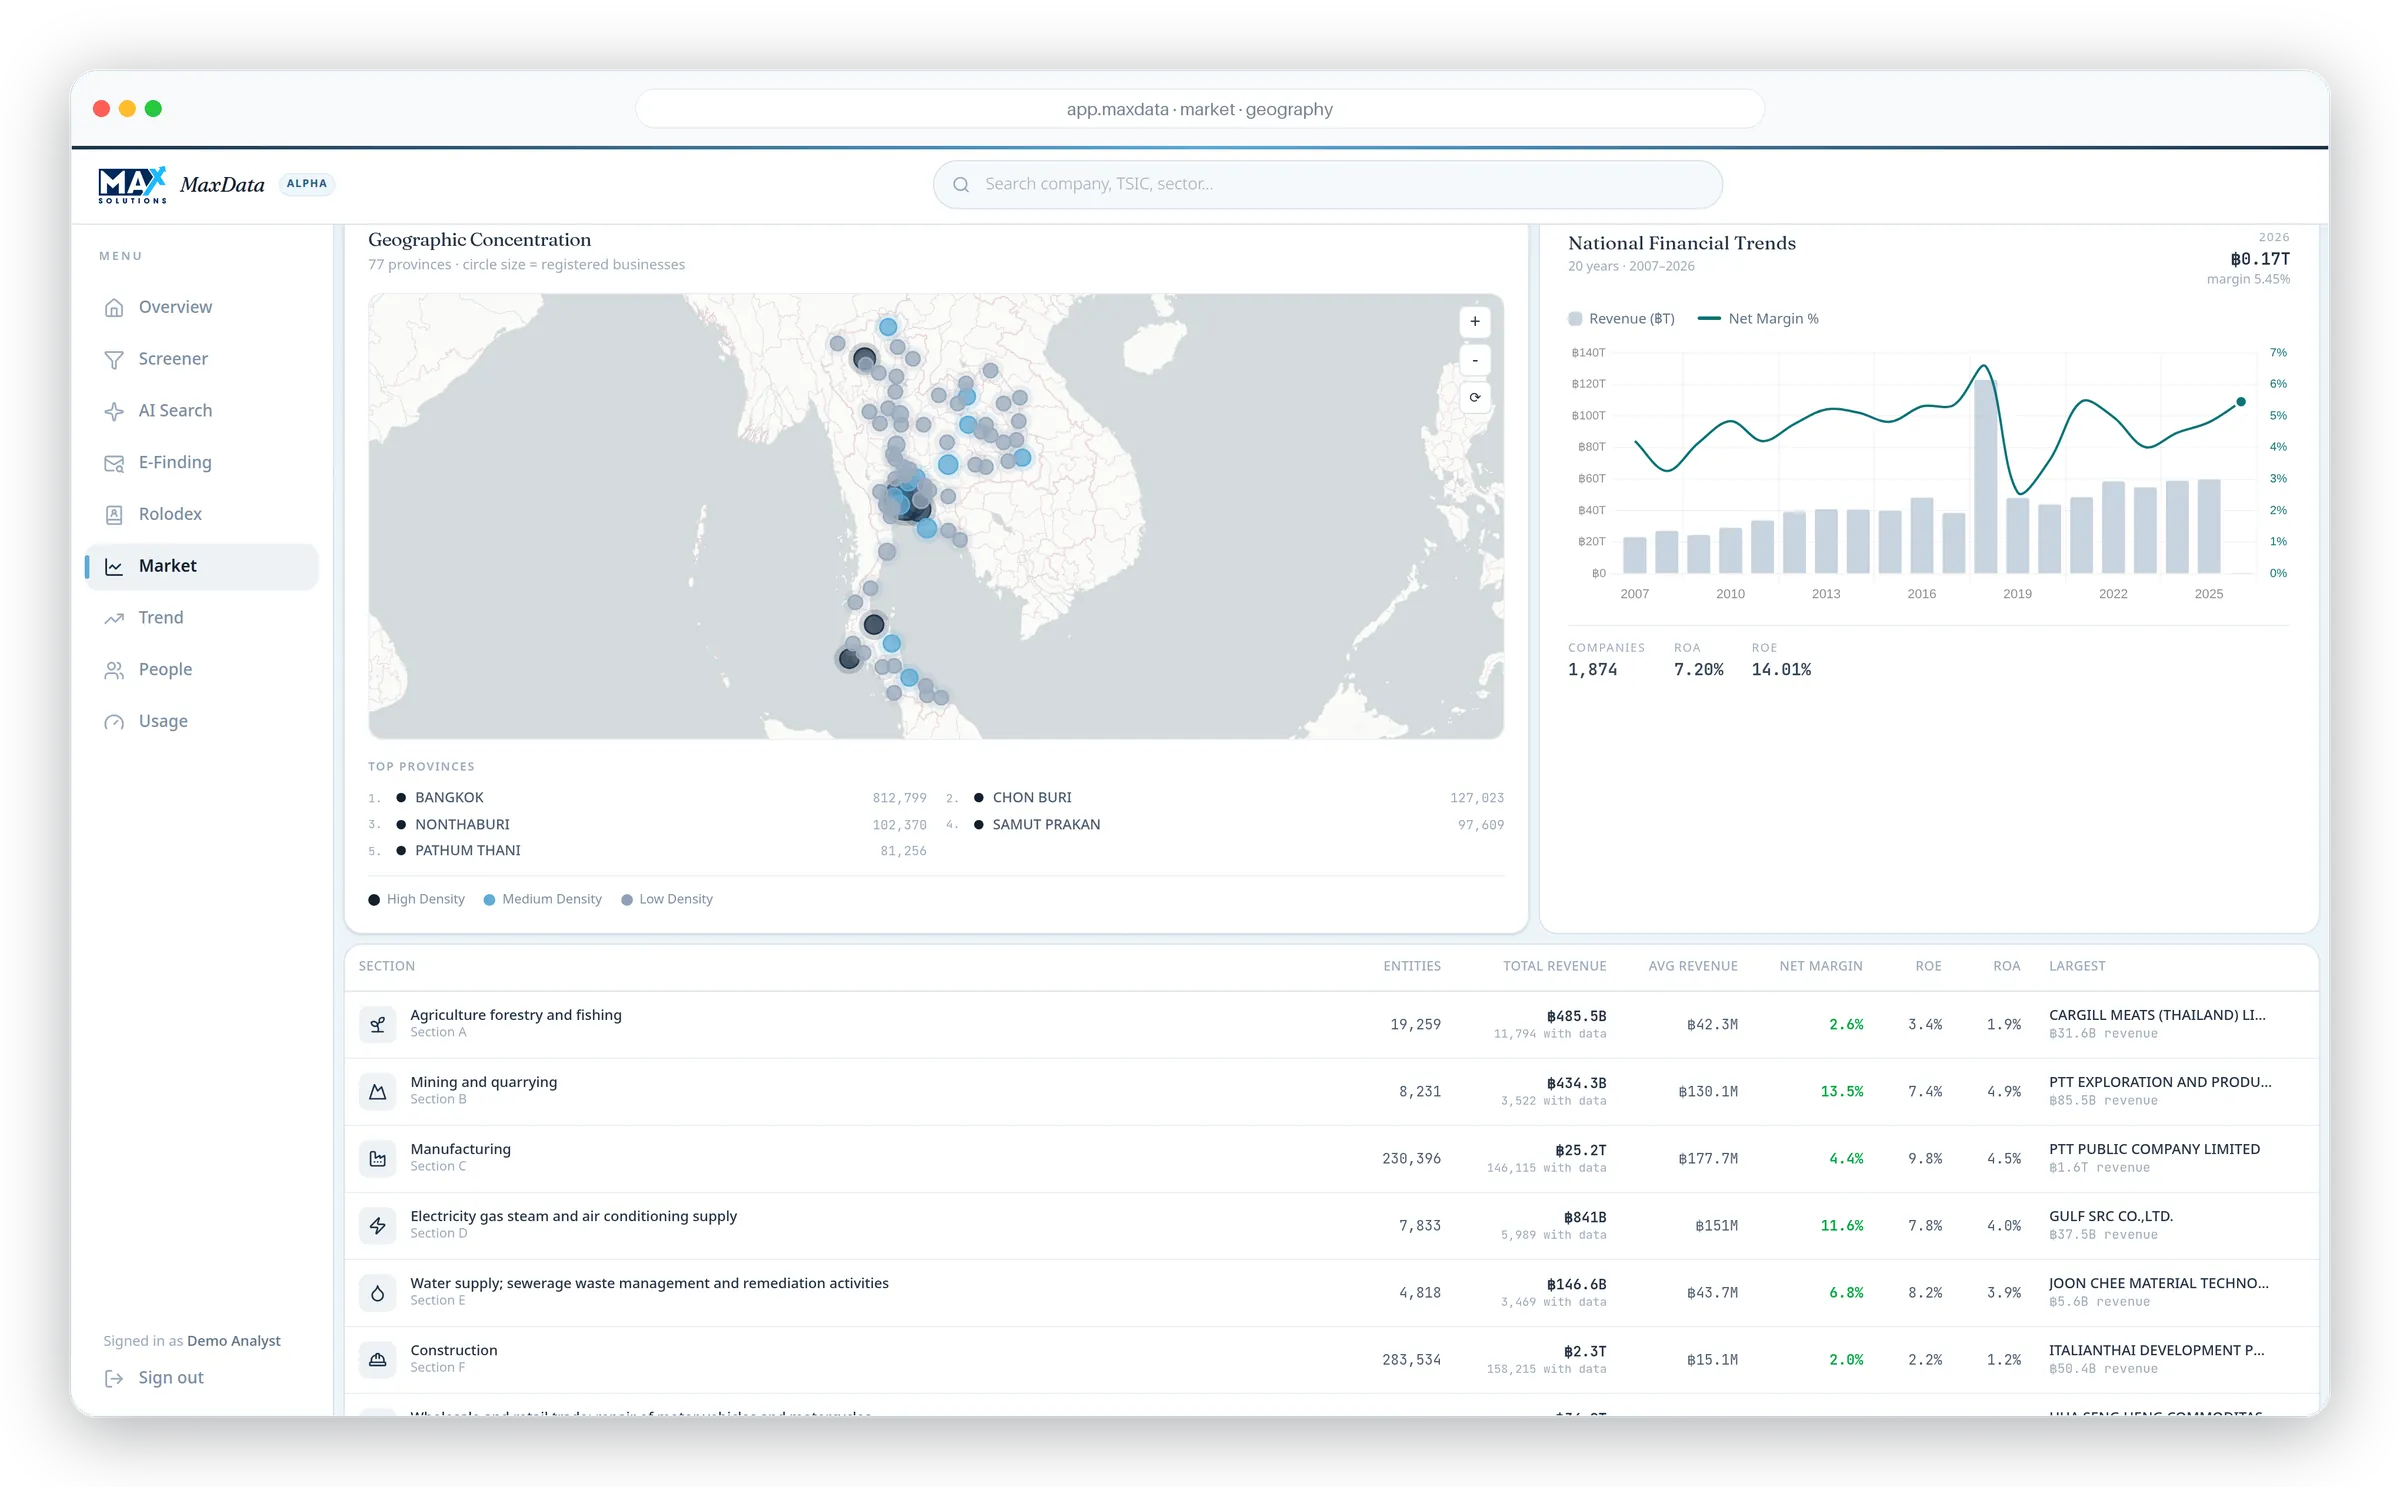
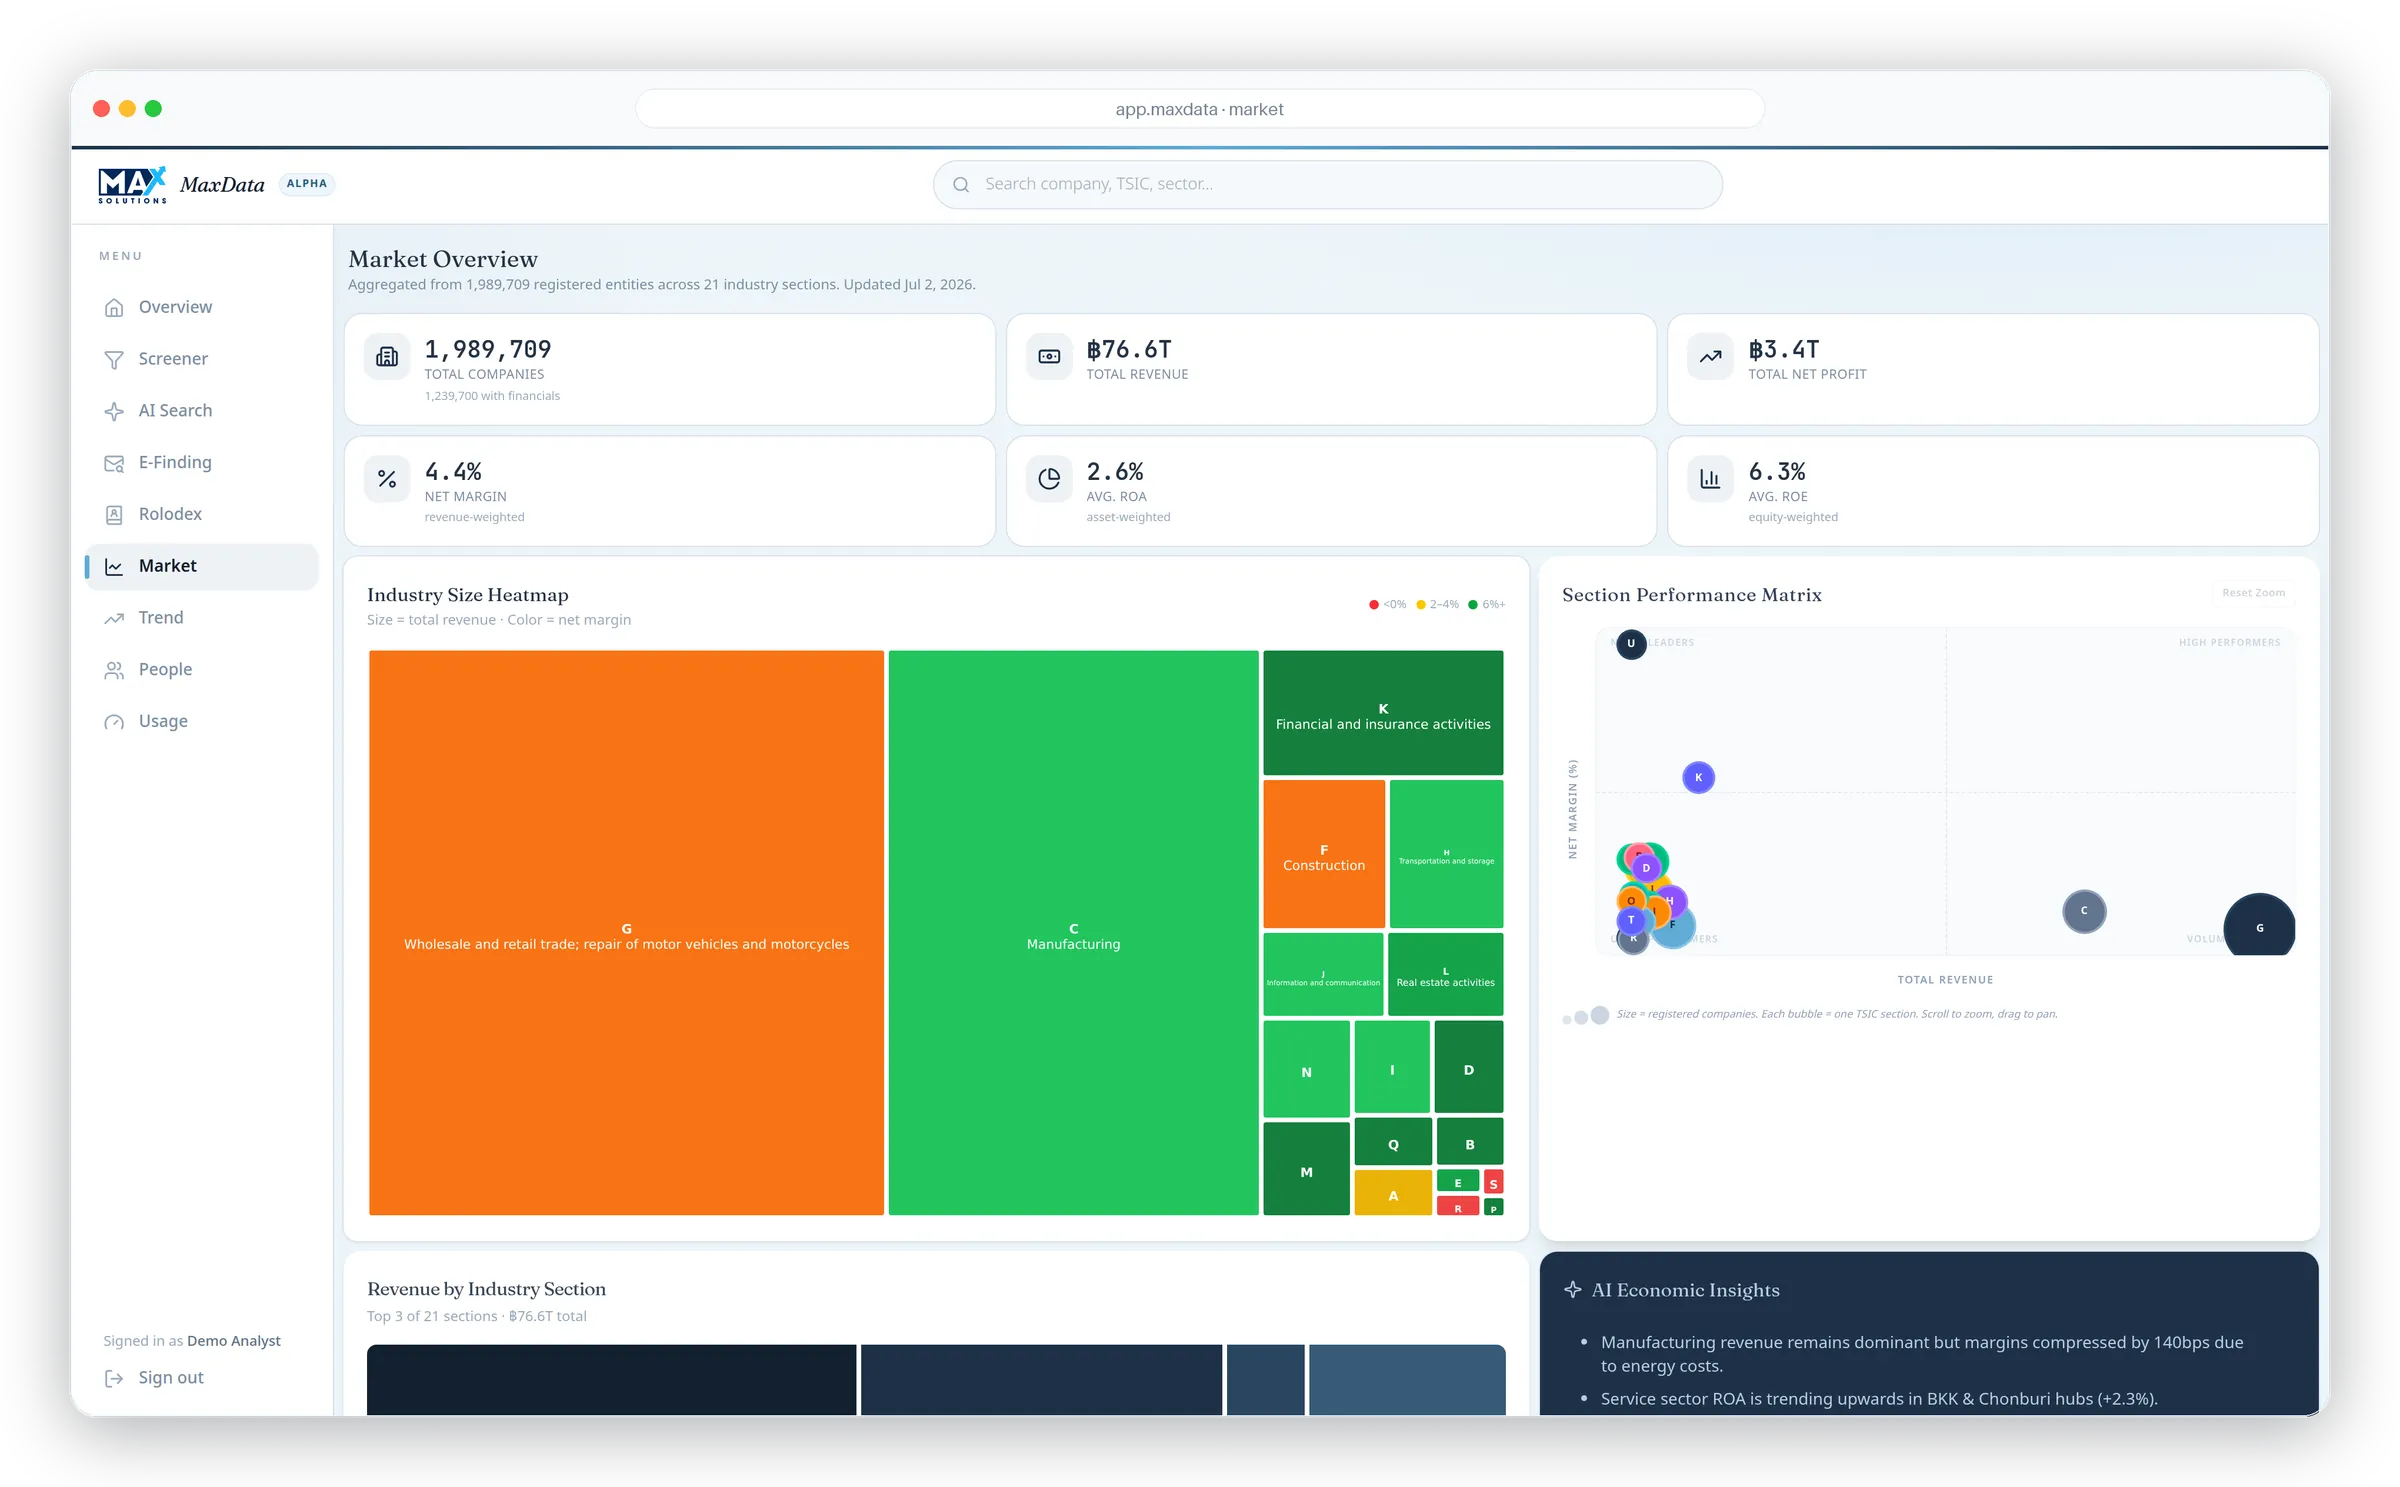
The Market view draws each industry as a treemap sized by revenue and colored by margin, so a glance shows you the big, healthy sectors and the small, thin ones. A sector attractiveness matrix plots growth against returns, and a geographic view shows where companies cluster across Thailand. From any block you drill down: section, then TSIC code, then a single company.
- Industry treemap sized by revenue, colored by margin.
- Sector attractiveness matrix: growth against returns.
- Geographic concentration across provinces.
- Drill from section to TSIC to a named company.
What are Rankings and Trends?
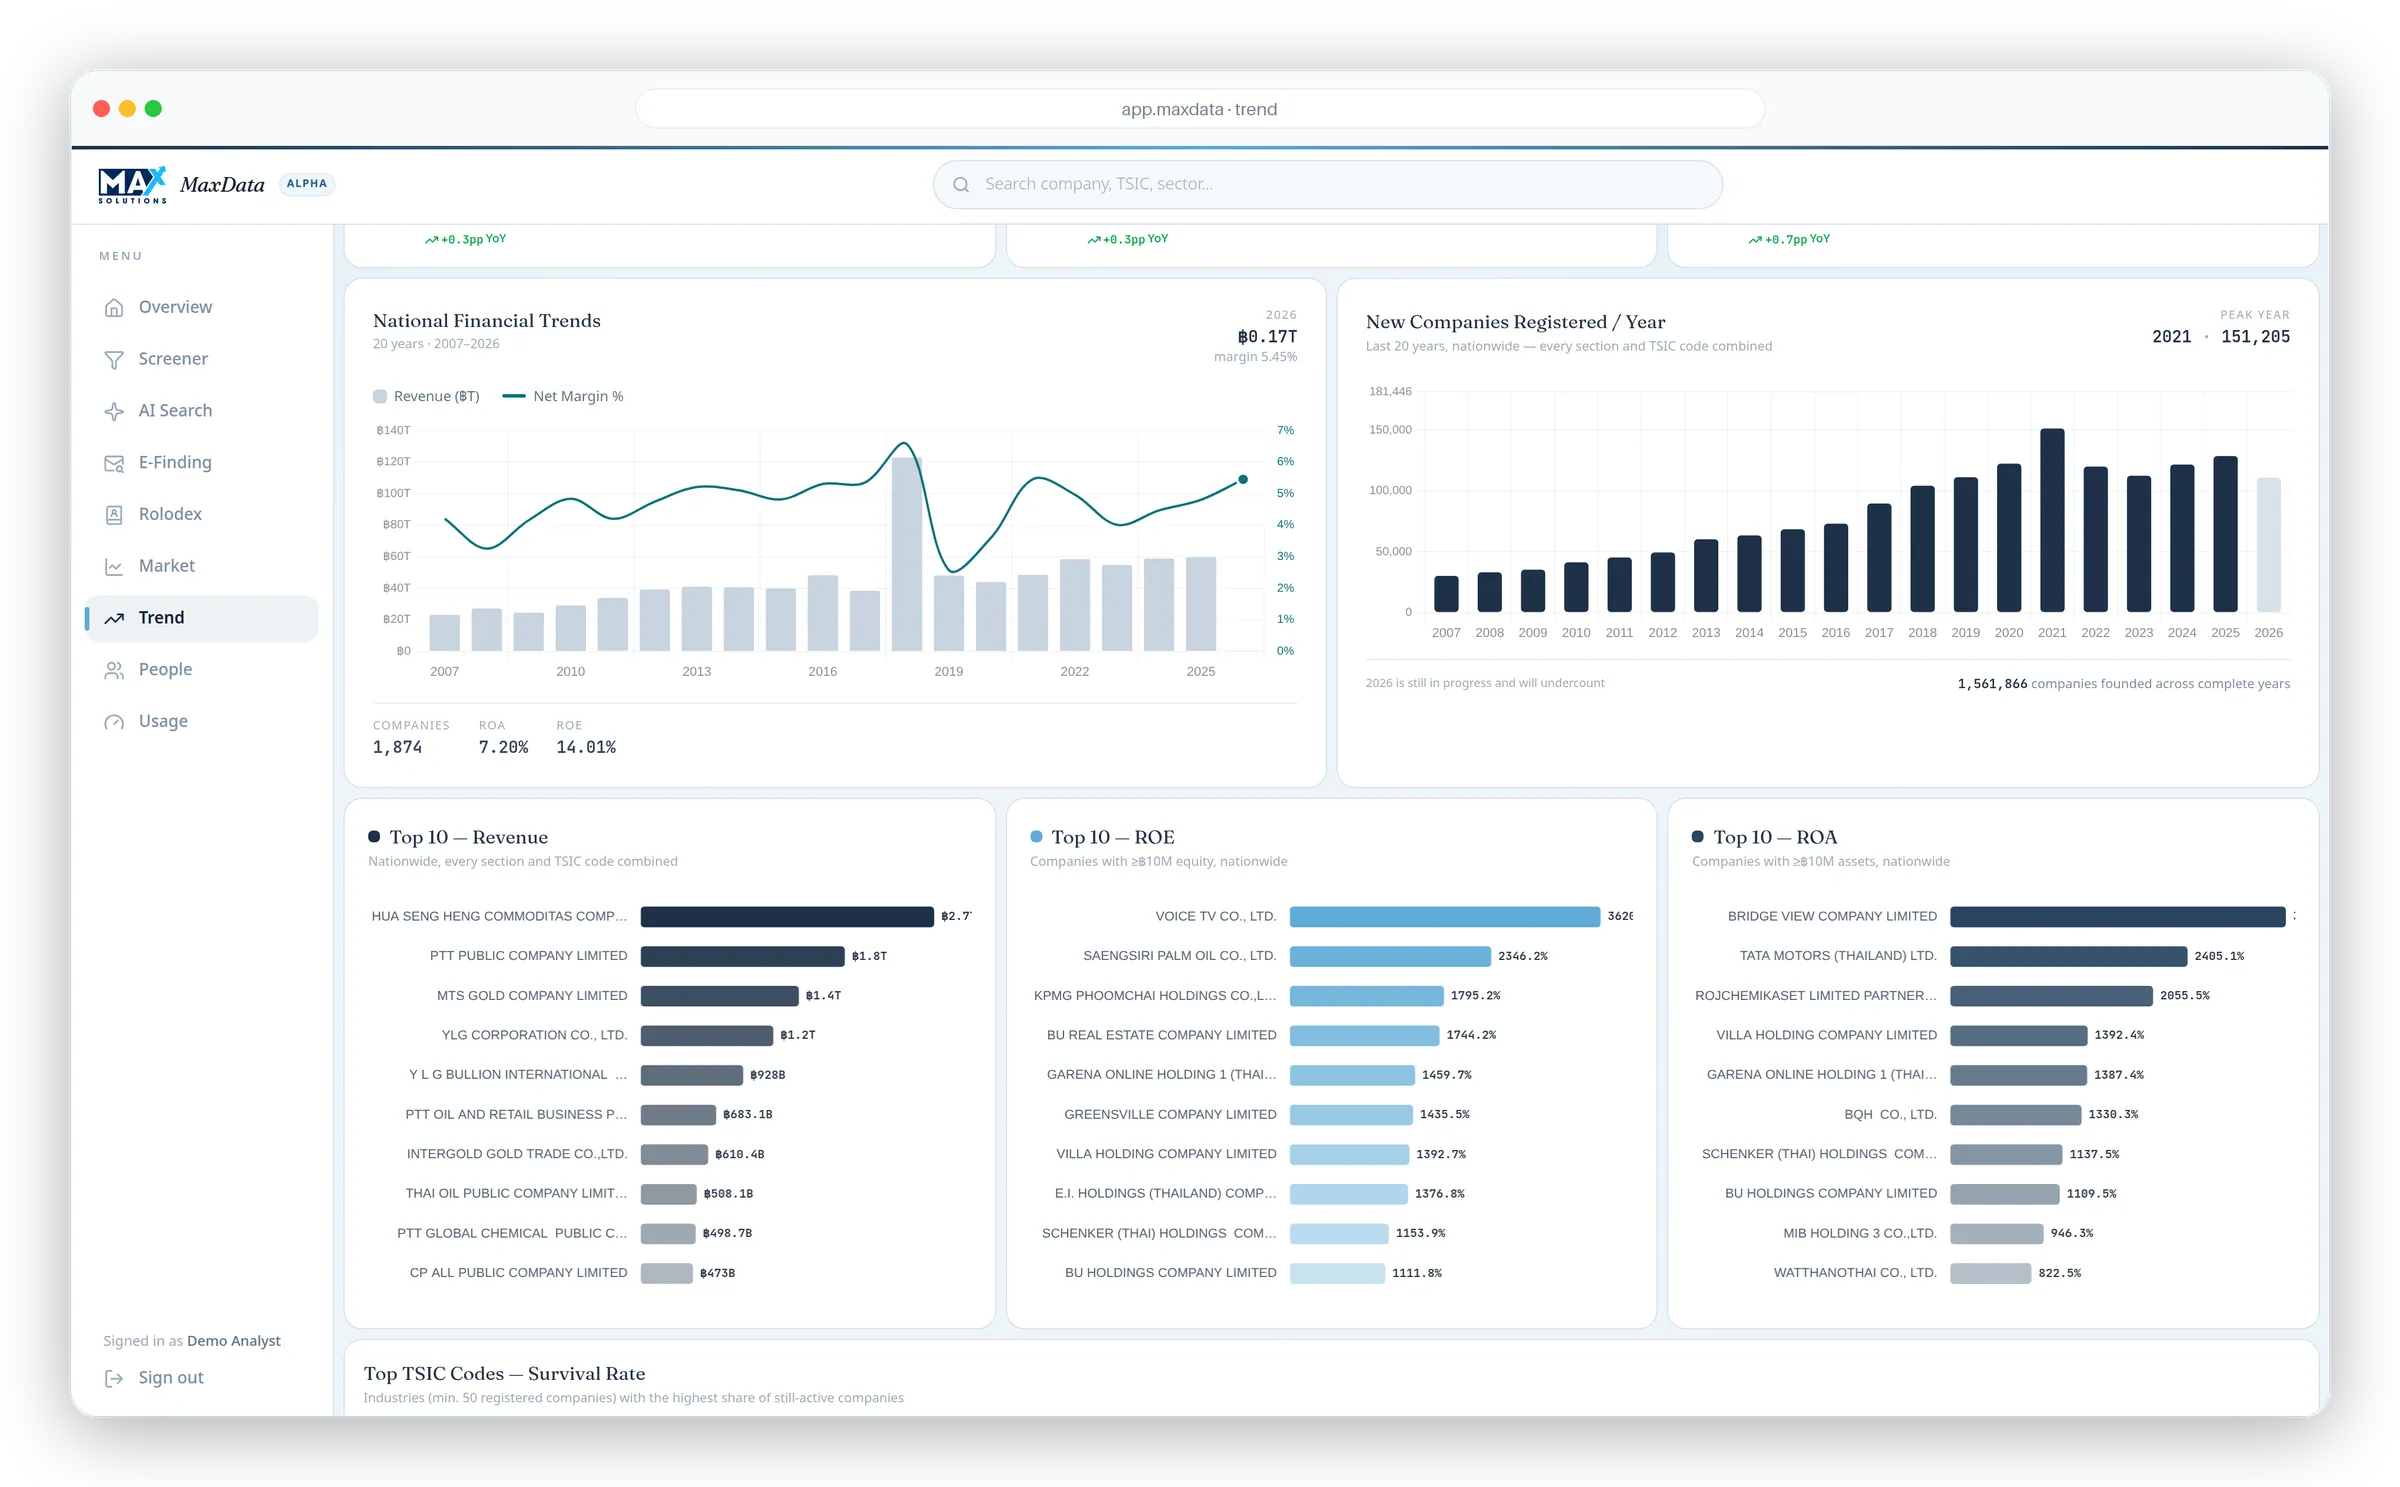
Rankings turn the whole registry into league tables. Sort companies by revenue, profit, margin, or ROE, nationally or inside any slice you choose. Trends then adds time: 20 years of national history, a year-over-year pulse, company-formation velocity, and survival rates by industry, so you can see which sectors are growing and which are thinning out.
- League tables by revenue, profit, margin, and ROE.
- 20-year national trends and a year-over-year pulse.
- Company-formation velocity and survival by industry.
- Full-dataset math across all 1,989,709 companies.
Note: the latest fiscal year is preliminary until filings settle, so recent-year lines are read as early signal, not final totals.
Who uses the Market view?
The Market view suits anyone who needs to size and understand a market before going deep.
Map your market.
Access is by application. Tell us the sector you cover and we will show you the map.
Frequently asked questions
Are Market figures based on a sample?
No. Market, Rankings, and Trends are computed across the full dataset of 1,989,709 companies. Because the whole registry is pre-aggregated, sector sizes and league tables reflect every filed company rather than a sampled slice.
How far back do the trends go?
Up to 20 years of national financial history. You can see year-over-year change, company-formation velocity, and survival by industry across that window. The most recent fiscal year is preliminary until filings settle, so we treat it as early signal.
Can I drill from a market down to a single company?
Yes. Start at the industry treemap, open a section, then a TSIC code, then an individual company with its full 20-year dossier. The same path works in reverse when you want to place one company inside its wider market.
We work with a selected group of teams.
Access is by application, and we review every one. Tell us what you want to do and we will be in touch quickly.
Talk on LINE: @maxsolutions, keyword "MAX DATA"